
Among various kinds of Linear Models used in Machine Learning, Linear Regression is one of the popular and basic models that every Data Scientists or Machine Learning Engineers (or some other names) read about. Before directly diving to Linear Regression let’s understand what exactly is the linear model.
Linear Model
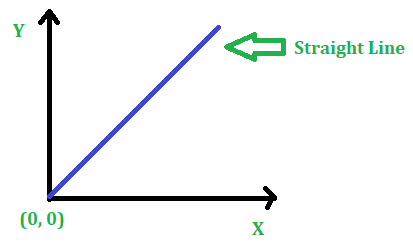
In simple words, we define “a linear model to have a linear relationship between the independent variable/s and the dependent variable. Mathematically, a linear model is an equation that describes the relationship between two quantities that shows a constant rate of change. Graphically, a linear relationship is represented as a straight line as shown in the figure”.
Now, we have a flavor of a linear model, let’s get back to Linear Regression.
Linear Regression
It is a statistical tool used to find the linear relationship between a dependent variable and one or more independent variable/s. When there is one independent variable, it is said to be Simple Linear Regression and when there are two or more independent variables are available, it is known as Multiple Linear Regression. This model is a Supervised Learning Model (here the data is labeled).
Mathematically, the Linear Regression equation is given as:
![]()
Where Yi is the dependent variable, Xi is independent variable, β0 is the intercept, β1 is the slope, and Εi is the random error.
IDEA: The main idea here is to find a line that best fits the data. The best fit line is the one for which total prediction error (for all the data points) is as small as possible.
Consider the below-fitted line to the given data points.
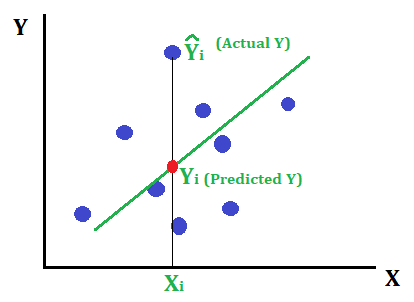
Error is nothing but the distance between the actual point and the fitted line. Mathematically,
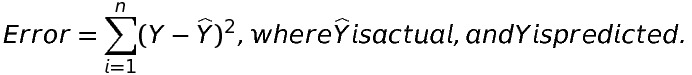
Note: Squared because if we don’t square the error, the point giving positive error and the point giving negative error may cancel each other.
Least Square Estimation
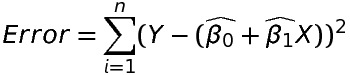
The parameters β0 and β1 are unknown and are estimated using the sample data. We estimate β0 and β1 so that the sum of squares of all the difference between the observation Yi and the fitted line is minimum i.e. the error is minimum.
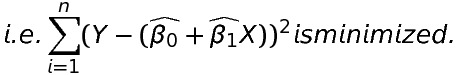
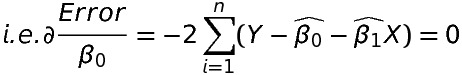
The least-square estimation of β0 and β1 (i.e. \widehat{\beta _{0}} and \widehat{\beta _{1}}) must satisfy the following two equations:
- The partial derivative of the error with respect to \beta _{0} should be zero.
2. The partial derivative of the error with respect to \beta _{1} should be zero.
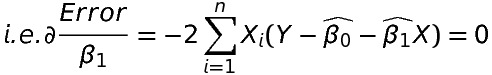
Both of the above equations are normal equations. There are two parameters \beta _{0} and \beta _{1}, so we have two equations, if we ‘k’ such parameters we would have got ‘k’ normal equations.
Solving equation 1 and equation 2 we get,

Now, putting the values of \widehat{\beta _{0}} and \widehat{\beta _{1}} in the original equation we get the fitted line to the given data.
Important points about parameters
- If \widehat{\beta _{1}} > 0, X and Y have a positive relationship. Increase in X will increase Y.
- If \widehat{\beta _{1}} < 0, X and Y have a negative relationship. Increase in X will decrease Y.
Important points about Linear Regression
- To build a Linear Regression model, there must be a linear relationship between independent and dependent variables.
- Linear Regression is very sensitive to outliers.
Recommended Post
- Python Interview Questions with Answers.
- SSL vs TLS.
- Difference between HDLC and PPP.
- HDLC protocol.
- Transport Layer Security (TLS)
- SSL programming in C.
- Socket programming in C.
- Parse XML response in C without using the library.
- Create Http Get and Post request in C.
- File handling in C.
- I2C Communication protocol.
- Embedded C Interview Questions.
- Pointers in C.
- CAN Protocol Interview Questions.
- Bit-wise interview Questions in C.